Solar Sales Continue Despite Summer Slowdown in Maricopa County

Phoenix solar statistics August 2024

The Phoenix real estate market continues to reflect the growing appetite for homes equipped with solar technology, even as the summer months typically bring a seasonal slowdown. August 2024 data from Maricopa County reveals an intricate market, offering key insights for both buyers and sellers navigating this evolving landscape.

Market Overview

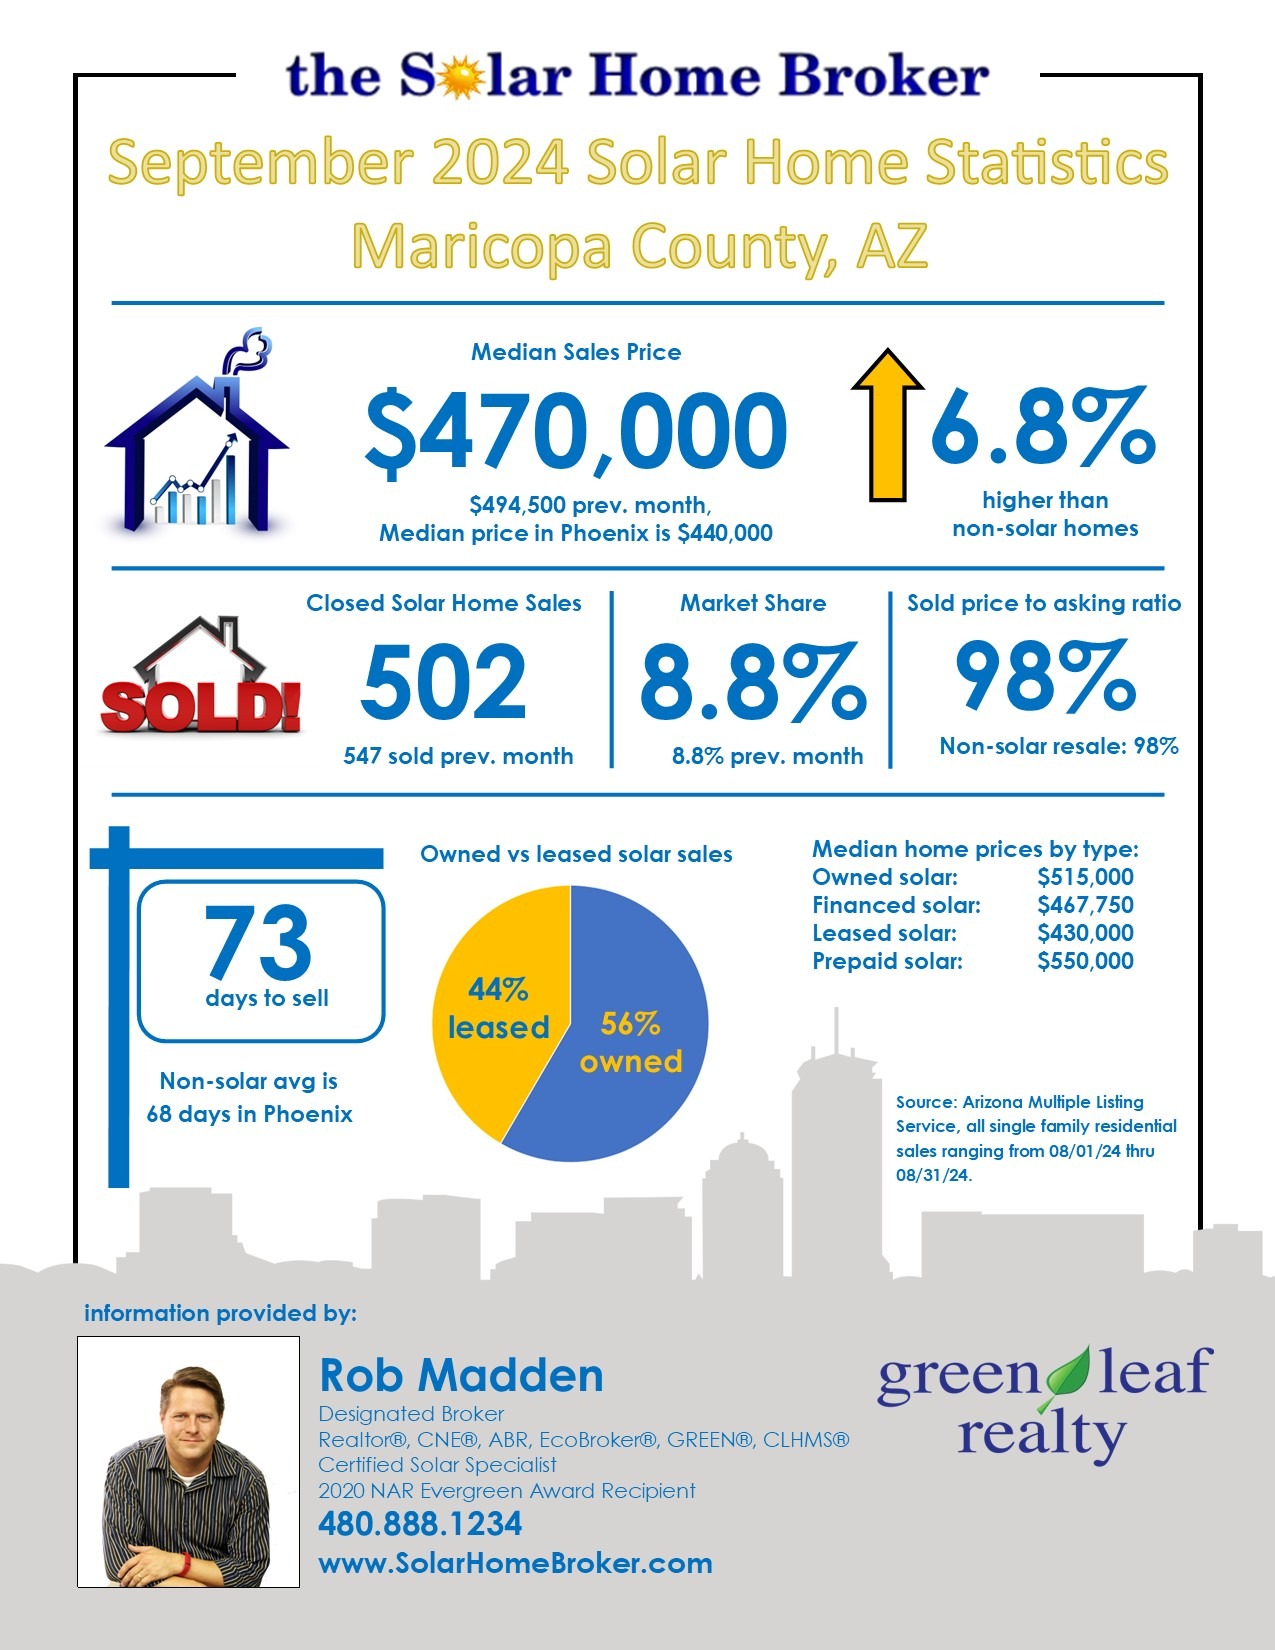
In August 2024, the median sales price for solar-equipped homes in Maricopa County saw a slight dip, reaching $470,000 from $494,500 in July. While this represents a modest decline, solar-powered homes remain a dynamic and valuable segment of the market, particularly due to the varying types of solar system arrangements:

  • Owned Solar Systems: Homes with fully owned solar systems commanded a premium, with a median sales price of $515,000. This trend reflects a strong buyer preference for ownership, as it eliminates ongoing payments and offers long-term financial benefits.
  • Financed Solar Systems: These homes saw a median price of $467,750, indicating continued demand among buyers willing to finance solar systems without the upfront cost of ownership.
  • Leased Solar Systems: Homes featuring leased solar systems fetched a median price of $430,000, reflecting a slight discount compared to owned systems due to the financial commitments tied to ongoing lease agreements.
  • Prepaid Leased Solar Systems: At the top end, homes with prepaid solar leases—eliminating future lease payments—saw a median price of $550,000, underscoring their appeal to buyers who want the benefits of solar without future financial obligations.

The market share for solar homes held steady at 8.8% in August, the same rate as in June and July, with 502 solar homes sold. This marks a decrease from the 547 solar home transactions recorded in July, pointing to some variability, possibly tied to broader economic conditions.

Pricing and Sales Performance

Solar homes in August 2024 sold for 98% of their listing price, a testament to their continued high demand and perceived value in the market. Non-solar homes also sold for 98% of their asking price, signaling that both segments are performing similarly in terms of negotiation and pricing. However, solar homes took slightly longer to sell, averaging 73 days on the market compared to 68 days for non-solar properties. This indicates that while buyers value the long-term benefits of solar, they may take more time to assess the higher price points and system complexities.

Market Preferences and Buyer Trends

The breakdown of solar home sales in August reveals distinct preferences among buyers:

  • Owned Solar Systems: Comprising 56% of the market, homes with owned solar systems continue to be the most sought after, appealing to buyers focused on long-term savings and property value enhancement.
  • Leased Solar Systems: Representing 44% of solar home sales, leased systems remain a significant portion of the market, appealing to buyers who prioritize immediate energy savings without the initial capital outlay.

Comparative Market Analysis

The broader Phoenix real estate market in August 2024 remained stable but dynamic, offering insight into the overall trends affecting both solar and non-solar home transactions:

  • Total Home Sales: The market recorded 5,724 home sales.
  • Median Sales Price: The general median sales price stayed steady at $440,000.
  • Average Sales Price: The average sales price edged upward to $638,304 from $602,490 in July, reflecting minor fluctuations in pricing across the market.
  • New Listings and Inventory: There were 8,801 new listings in August, contributing to a total inventory of 18,368 active listings, signaling a balanced supply in the market.
  • Absorption Rate: The absorption rate rose slightly to 3.21 months from 2.82 months, in line with typical seasonal adjustments during the summer months.
  • Cash Purchases: Cash transactions made up 21.5% of total sales, with a median price of $440,000, highlighting strong competition among cash buyers.

Conclusion

Despite a slight slowdown in the summer months, the market for solar-equipped homes in Phoenix remains robust and resilient. August 2024 data highlights the ongoing value that buyers place on sustainability and energy efficiency, which continue to drive interest in solar properties. As solar technology becomes more mainstream and accessible, its market appeal is expected to grow, positioning solar homes as a key player in Phoenix’s real estate landscape.

For real estate professionals and homebuyers alike, staying informed about these trends is essential. Understanding the financial and environmental advantages of solar energy can provide a competitive edge in the market, ensuring buyers and sellers are well-positioned to capitalize on the evolving demand for energy-efficient homes.

You can download a PDF version of the Maricopa County Solar Statistics by clicking: https://www.solarhomebroker.com/wp-content/uploads/2024/09/Maricopa-Solar-Stats-Sep-2024.pdf
Phoenix’s Solar-Powered Resurgence: An In-depth Look at the Solar Home Sales in July 2024

July 2024 phoenix az solar home sales and statistics

The real estate market in Phoenix continues to illustrate the growing demand and appreciation for homes equipped with solar technology. As of June 2024, the data reflects a nuanced landscape with variations in market dynamics, offering valuable insights for both home buyers and sellers.

Market Overview

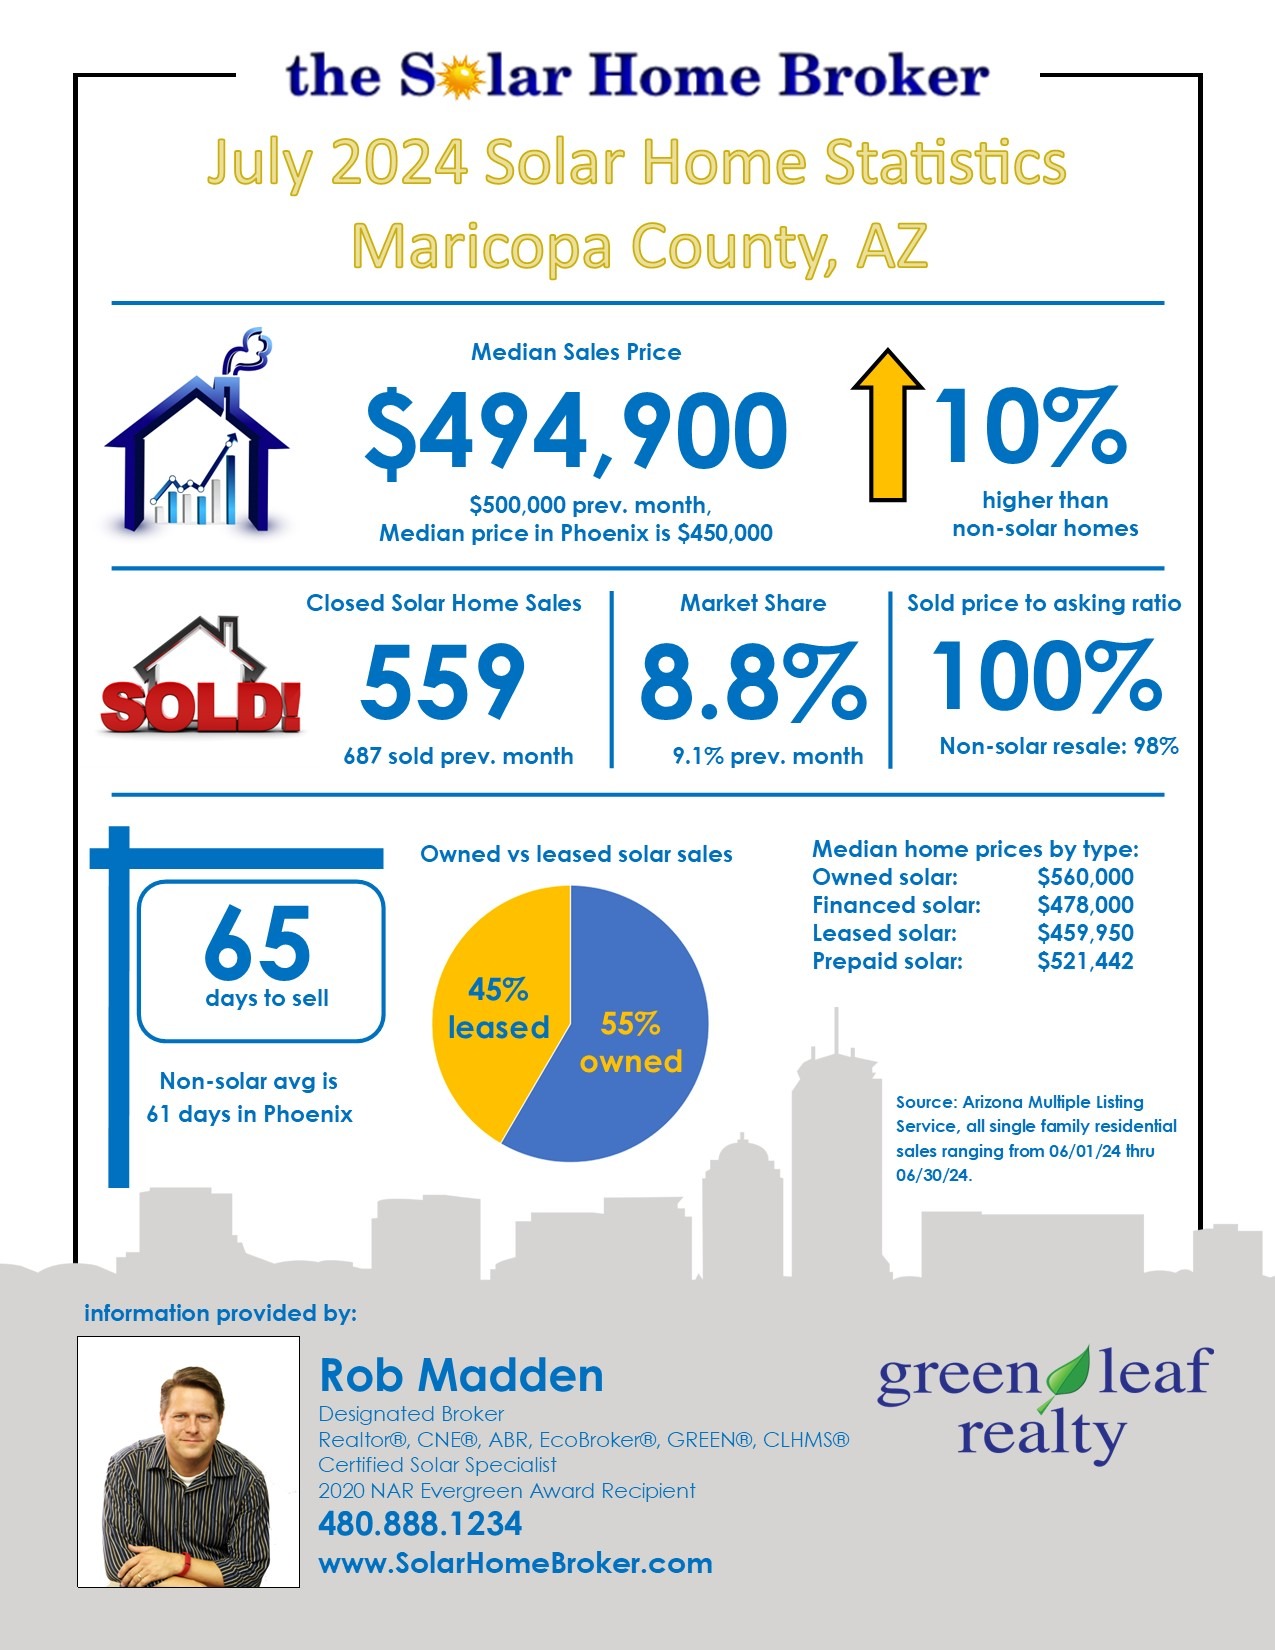
In June 2024, the median sales price for solar-equipped homes in Maricopa County slightly decreased to $494,900, down from $500,000 in May. Despite this minor dip, solar homes remain a robust segment of the market, particularly notable for their variety based on solar arrangements:

  • Owned Solar Systems: Homes with owned solar systems commanded a median price of $560,000. This category continues to attract a premium, underscoring the market’s preference for fully owned solar installations.
  • Financed Solar Systems: These homes recorded a median price of $478,000, which indicates a willingness among buyers to invest in solar energy without the upfront costs of ownership.
  • Leased Solar Systems: Homes with leased solar systems fetched a median price of $459,950, reflecting a slight discount due to the ongoing financial commitments associated with leasing.
  • Prepaid Leased Solar Systems: These homes saw a median price of $521,442, positioning themselves as an attractive middle ground for buyers seeking the benefits of solar without future lease payments.

The market share of solar homes slightly declined to 8.8% in June from 9.1% in May, with a total of 559 solar homes sold. This decrease in volume, from 687 homes in May, indicates a fluctuating interest, potentially influenced by broader market conditions.

Pricing and Sales Efficiency

Solar homes in June 2024 sold for 100% of their asking price, a testament to their high demand and perceived value. In contrast, non-solar homes sold for 98% of their asking price. However, solar homes took slightly longer to sell, averaging 65 days on the market compared to 62 days for non-solar homes. This trend suggests that while solar homes are highly valued, buyers may take more time to finalize their decisions due to the higher price points and considerations related to solar systems.

Market Composition and Preferences

The distribution of solar home sales reveals interesting preferences among buyers:

  • Owned Solar Systems: 55% of the solar homes sold had owned systems, reflecting a strong preference for ownership and the associated long-term benefits.
  • Leased Solar Systems: 45% of the solar homes sold had leased systems, indicating a substantial segment of the market is still drawn to the immediate benefits of solar energy without the initial investment.

Comparative Market Analysis

The broader Phoenix real estate market in June 2024 presented a stable yet dynamic environment:

  • Total Home Sales: The market recorded 7,115 transactions.
  • Median Home Sales Price: The general market median sales price remained steady at $450,000.
  • Average Sales Price: The average sales price slightly decreased to $592,885 from $598,882 in May, reflecting minor fluctuations in market activity.
  • New Listings and Inventory: There were 8,115 new listings, contributing to a total of 17,833 active listings, indicating a healthy supply of homes.
  • Absorption Rate: The absorption rate increased slightly to 2.82 months from 2.36 months, highlighting the seasonality of the summer months in the local market.
  • Cash Purchases: Cash purchases represented 22.2% of the market, with a median cash price of $467,000, reflecting a competitive landscape among cash buyers.

Conclusion

The Phoenix real estate market for solar-equipped homes continues to show resilience and potential for growth. The data from June 2024 underscores the sustained value attributed to sustainability and energy efficiency by modern homebuyers. As solar technology becomes more widespread and accessible, its market appeal is expected to grow, driving an upward trajectory for solar homes in Phoenix.

For real estate professionals and buyers, understanding these trends is crucial. Considering the long-term benefits and potential value enhancements that solar technology brings to properties can offer significant advantages. Staying informed and adaptable will be key to leveraging the opportunities within Phoenix’s evolving real estate environment.

You can download a PDF version of the Phoenix solar statistics by clicking on: https://www.solarhomebroker.com/wp-content/uploads/2024/07/Maricopa-Solar-Stats-July-2024.pdf

Rising Demand and Value: June 2024 Sees Increased Interest in Phoenix Solar Homes

Phoenix’s Solar-Powered Resurgence: An In-depth Look at the Solar Home Sales in June 2024

The real estate market in Phoenix, particularly for homes equipped with solar technology, has showcased a significant and progressive shift in consumer preference and market dynamics. As of May 2024, the data reveals a robust increase in the median sales price of solar homes and a marked rise in their market share, underscoring a growing acknowledgment of the value and benefits of sustainable living.

Market Overview

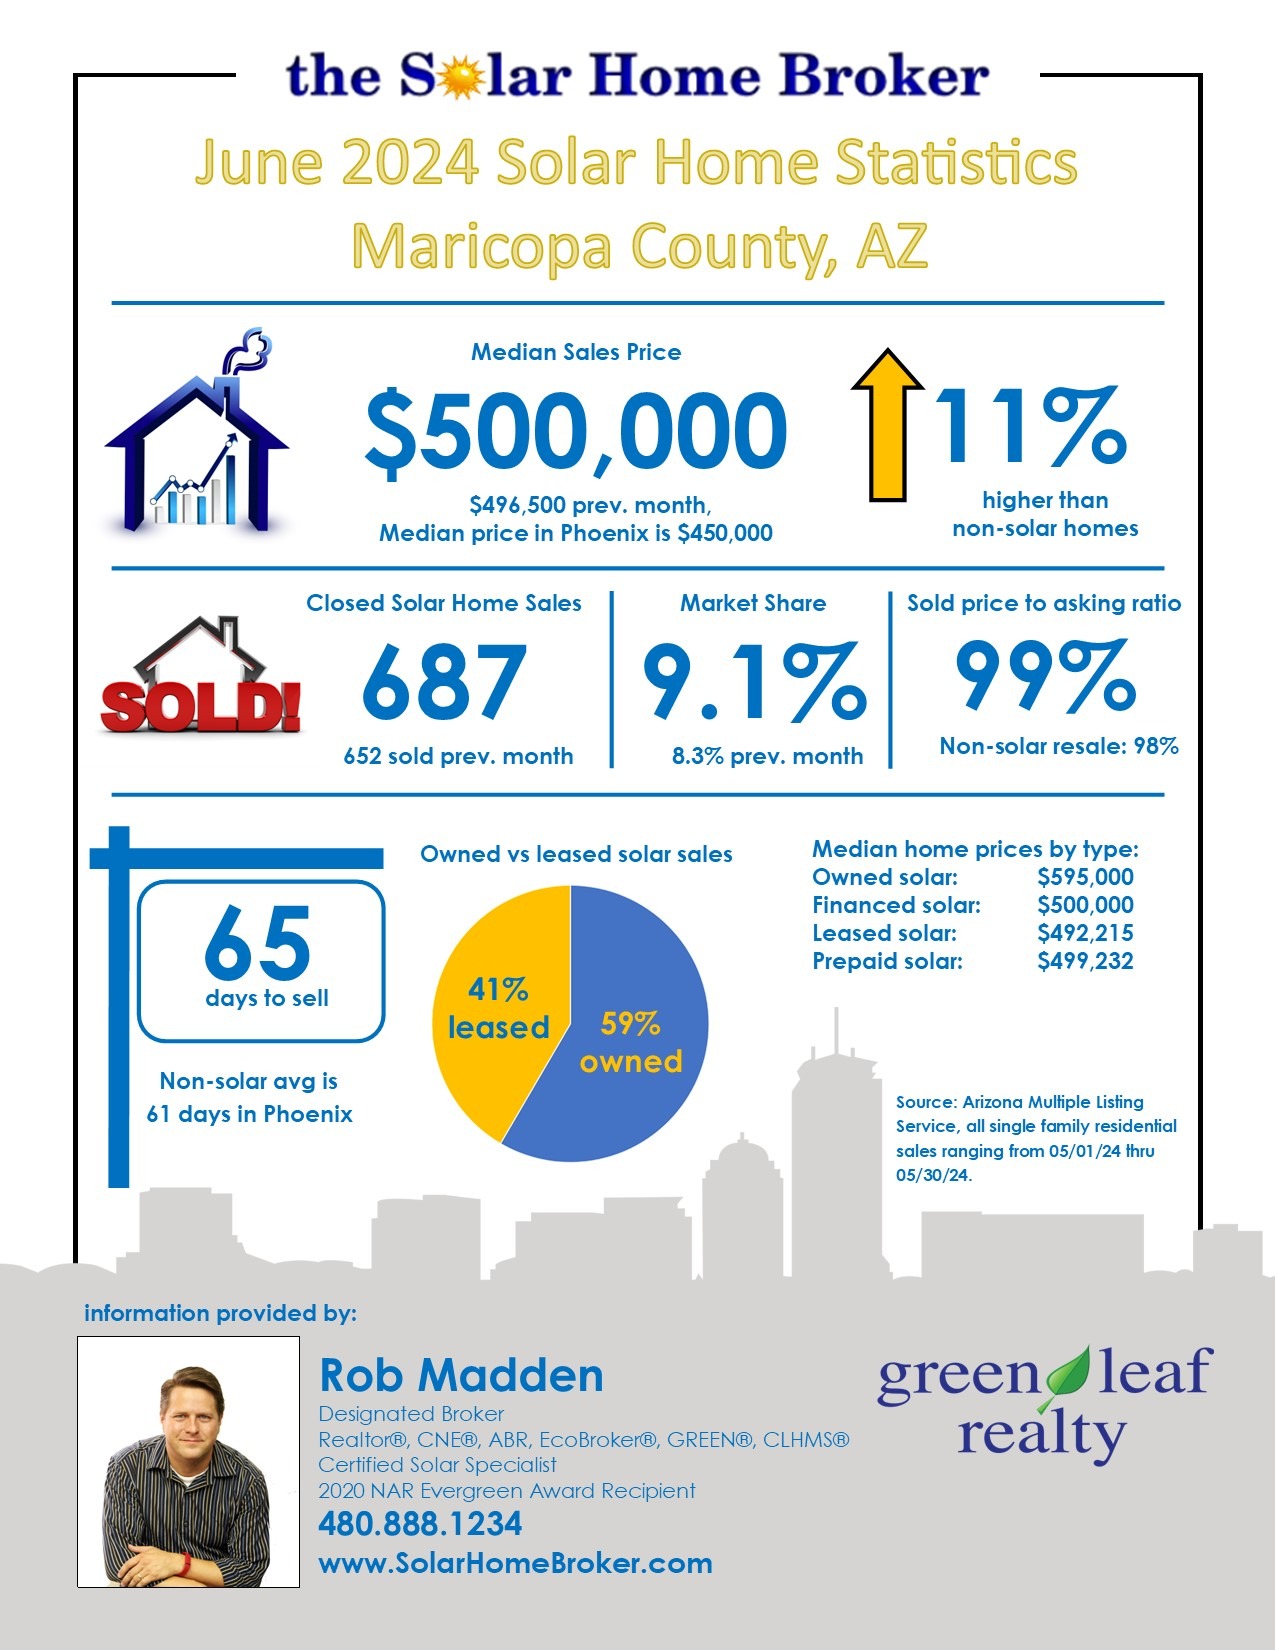
In May 2024, the median sales price for solar-equipped homes in Maricopa County rose to $500,000, a notable increase from $496,500 in April and significantly higher than the $469,750 recorded a year prior. This 6.44% year-over-year increase outpaces the general market trends and highlights an accelerating interest in homes with solar installations. The breakdown of prices based on the type of solar arrangement is particularly telling:

  • Homes with owned solar systems commanded the highest median price at $595,000, reflecting the premium that buyers are willing to pay for homes with fully owned solar installations.
  • Homes with financed solar matched the county’s overall median at $500,000, suggesting that the benefits of solar power—without the upfront costs of ownership—are equally valued.
  • Leased solar homes and those with prepaid leased agreements fetched slightly less, at $492,215 and $499,232 respectively, indicating a slight discount due to the ongoing financial commitments associated with leasing.

The transaction volume of solar homes also saw an uptick, with 687 homes closing in May, rising from 652 in April. This increase pushed the market share of solar homes to 9.1%, a sharp rise from 8.3% the previous month, suggesting a significant shift towards renewable energy solutions in residential properties.

Pricing and Sales Efficiency

Despite the higher pricing, solar homes sold for 99% of their asking price, a percent higher than their non-solar counterparts, which managed 98%. This statistic not only demonstrates the high demand for these homes but also reflects the growing buyer recognition of their long-term value and cost savings.

However, it took slightly longer to sell a solar home compared to a non-solar one—65 days over 61 days for traditional homes. This could indicate a need for better market positioning or could reflect a more discerning buyer pool that takes additional time to commit to higher-priced properties.

Market Composition and Preferences

The composition of the solar home sales is particularly interesting: 41% of these homes had leased solar systems, while the majority, 59%, had owned systems. This distribution underscores a clear preference for owned solar systems, which likely stems from the direct control and absence of ongoing lease payments, enhancing property values and attractiveness to potential buyers.

Comparative Market Analysis

Looking at the broader Phoenix real estate market in May 2024, the scene was vibrant with a 7.2% month-over-month increase in total home sales, reaching 7,531 transactions. The median home sales price held steady at $450,000, underscoring a stable yet competitive market environment. The slight decline in the average sales price to $598,802 from $611,577 the previous month suggests some variability in the market, potentially driven by a higher number of lower-priced or smaller homes changing hands.

New listings slightly decreased but remained strong, ensuring a healthy supply of homes. The inventory levels rose by 3.9%, with a quicker pace of sales as evidenced by a reduced absorption rate from 3.45 months in April to 3.06 months in May, indicating a robust, seller-friendly market.

Cash purchases slightly declined, representing 23.9% of the market, yet the dip in median cash price to $470,000 from $485,000 points towards a very competitive scenario among cash buyers, reflecting continued strong demand and competition in the market.

Conclusion

The Phoenix real estate market, particularly for solar-equipped homes, has not only demonstrated resilience but also significant growth potential. The data from May 2024 provides a clear indicator of the value attributed to sustainability and energy efficiency by today’s homebuyers. As solar technology becomes more mainstream and accessible, and as more consumers recognize its economic and environmental benefits, the market for solar homes in Phoenix is expected to continue its upward trajectory.

For real estate professionals and buyers alike, understanding these trends is crucial. Those considering entering the market, whether buying or selling, should consider the long-term benefits and potential value enhancements that solar technology can bring to a property. As the market evolves, staying informed and adaptable will be key to leveraging the opportunities that Phoenix’s thriving real estate environment has to offer.

To download a PDF version of this information, you can click here: https://www.solarhomebroker.com/wp-content/uploads/2024/06/Maricopa-Solar-Stats-June-2024.pdf

Solar Homes Continue to Outpace Phoenix Real Estate Market – May 2024

Phoenix solar home sales statistics for May 2024

Phoenix’s Solar Home Market in May 2024: A Detailed Analysis of Trends and Economic Impact

As the Phoenix housing market moves from spring into summer, the solar home sector continues to showcase distinctive trends that differentiate it from the broader market. This past April, we’ve observed nuanced changes in pricing, sales volume, and market dynamics that provide deeper insight into the state of solar home sales. With environmental consciousness on the rise and economic factors at play, solar homes in Phoenix are not just a niche market but a significant part of the housing landscape.

Current Trends in Solar Home Pricing and Sales

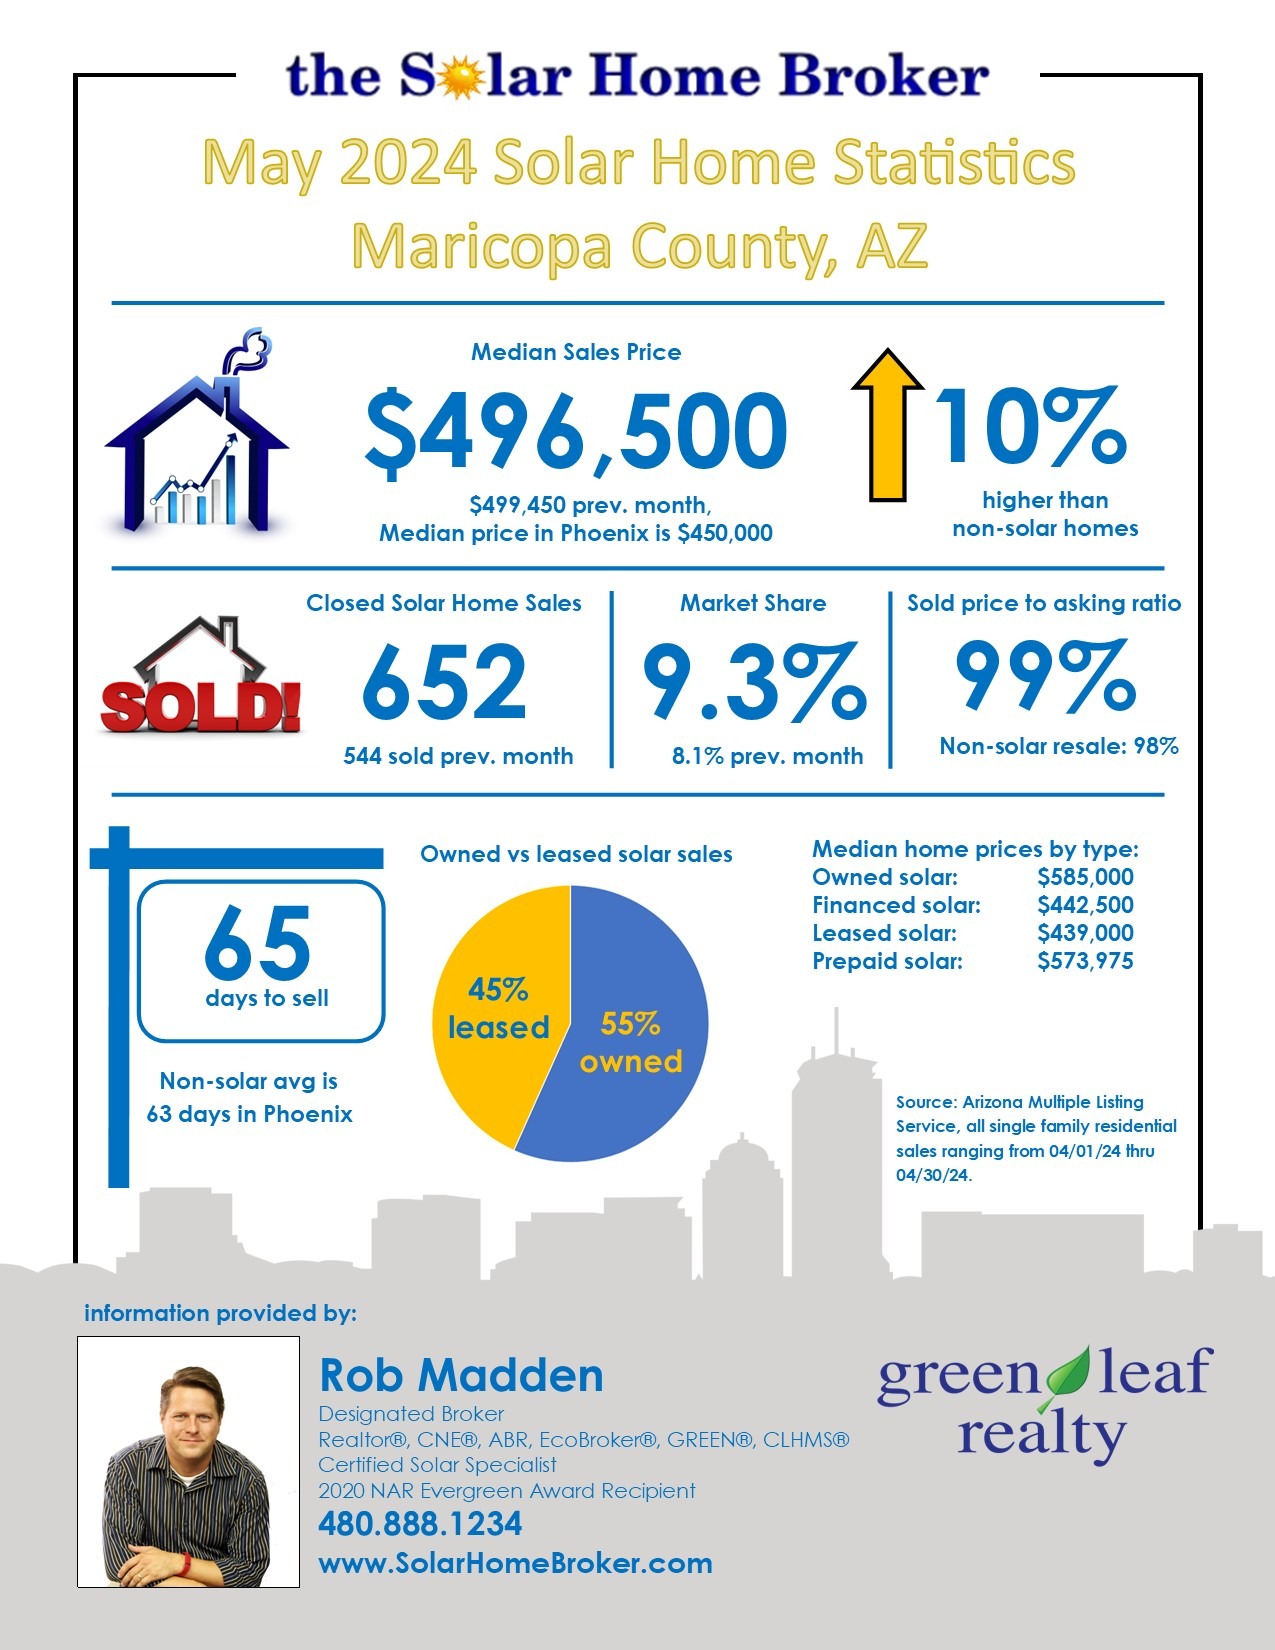
In April 2024, the median price for all solar homes in Phoenix rose to $496,500, marking a decrease from $499,450 in March. The specifics of the market, however, reveal more detailed shifts:

  • Owned Solar Systems: Homes with owned solar systems saw an increase in median price to $585,000 from March’s $562,500. These homes remain highly valued, suggesting that homeownership combined with solar capabilities is highly sought after due to the long-term savings and independence from utility companies.
  • Financed Solar Systems: The median price for homes with financed solar systems decreased to $442,500 from $452,000. This decline may reflect changing credit conditions or buyer caution in a fluctuating economic environment.
  • Leased Solar Systems: Homes with leased solar systems experienced a slight decrease to $439,000 from $449,500, indicating a steady interest in more affordable solar home options.
  • Prepaid Solar Lease Systems: The median price for homes with prepaid solar leases saw a significant adjustment to $573,975 from $608,675, possibly due to their perceived long-term value and the elimination of ongoing lease payments.

Comparison with the Broader Market

The median price for all resale homes in Phoenix was $450,000, which is slightly less than the median price for solar homes, reinforcing the premium that buyers are willing to pay for solar features. The broader market saw a mild increase from $444,945 in March, indicating steady growth across the board.

In terms of sales volume, 652 solar homes were sold in April, accounting for 9.3% of the total resale volume. This represents a significant segment of the market dedicated to environmentally friendly living solutions.

Historical Context and Year-over-Year Changes

Comparing year-over-year data, the median price of solar homes has increased by an impressive margin from April 2023, significantly outpacing the general market’s growth. This robust appreciation reflects the increasing valuation of solar technology in residential properties. However, the volume of solar homes sold has experienced fluctuations, suggesting market dynamics influenced by various factors such as economic conditions and buyer preferences.

Market Health and Economic Indicators

Phoenix’s housing market remains tight with just above 17,000 units available, up 39% from last year, yet still limited in the context of growing demand. With a supply of just 2.4 months, the market conditions favor sellers, keeping competition high among buyers. Foreclosure rates remain low, indicating a healthy market overall.

Mortgage rates have stabilized around 7%, still higher than the preferred 5% or lower, which continues to impact buyer affordability and seller willingness to list properties. The economic outlook is cautiously optimistic, buoyed by controlled inflation and the potential for interest rate reductions by the Federal Reserve, which could invigorate the market further.

Conclusion

As we analyze the solar home market in Phoenix in April 2024, it’s clear that these homes are more than just an eco-friendly option; they are a significant and growing component of the housing market landscape. With their ability to attract higher offers and close at rates above non-solar homes, solar properties offer compelling value, both in terms of real estate investment and environmental impact. Looking ahead, the solar home market in Phoenix is poised for continued growth and evolution, shaped by technological advancements, economic factors, and increasing consumer demand for sustainable living options.

You can download a PDF version of this report by clicking: https://www.solarhomebroker.com/wp-content/uploads/2024/05/Maricopa-Solar-Stats-May-2024.pdf

A version of this article can be found at: https://www.phoenixhomebuying.com/maricopa-county-solar-home-sales-may-2024/

Phoenix solar home statistics April 2024

Phoenix’s Solar Home Market in March 2024: A Detailed Analysis of Trends and Economic Impact

As the Phoenix housing market moves into the spring of 2024, the solar home sector continues to showcase distinctive trends that differentiate it from the broader market. This March, we’ve observed nuanced changes in pricing, sales volume, and market dynamics that provide deeper insight into the state of solar home sales. With environmental consciousness on the rise and economic factors at play, solar homes in Phoenix are not just a niche market but a significant part of the housing landscape.

Current Trends in Solar Home Pricing and Sales

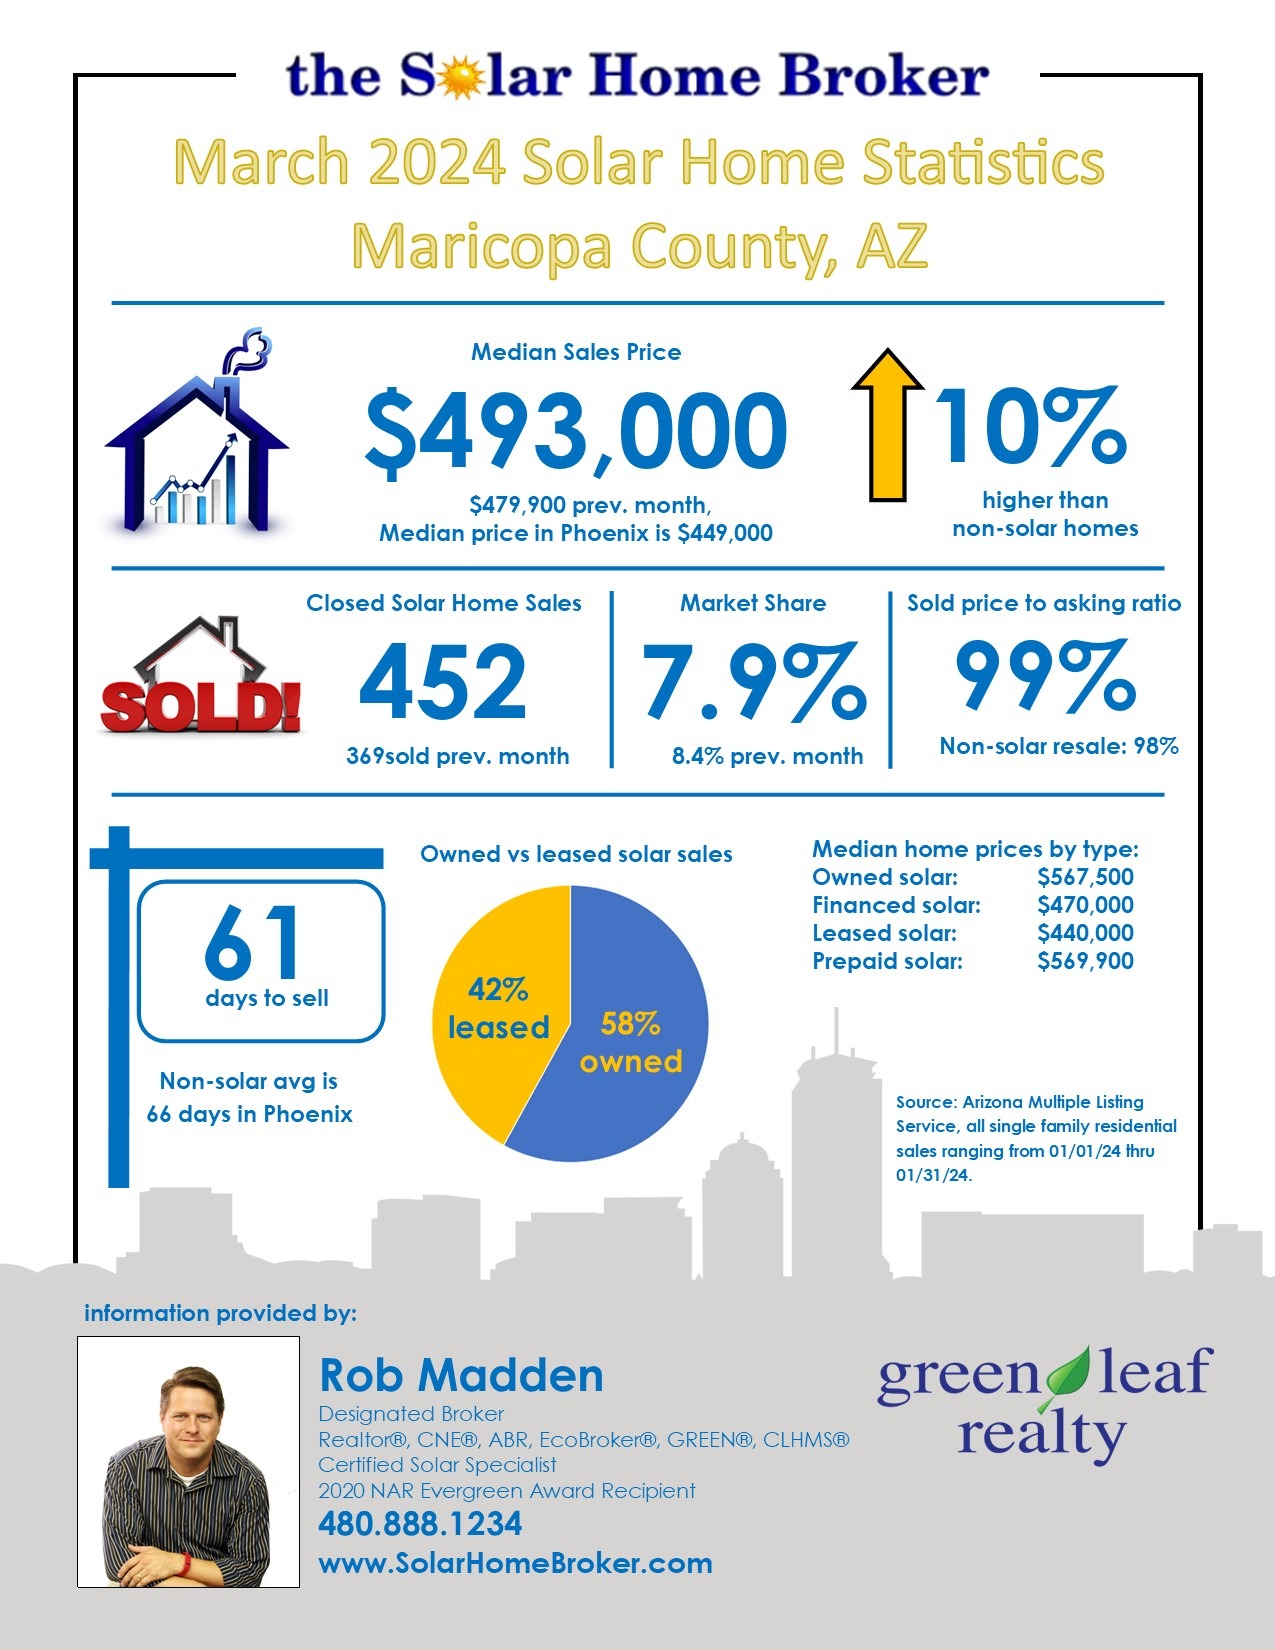
In March 2024, the median price for all solar homes in Phoenix rose to $499,450, marking a steady increase from $493,000 in February. This continued upward trend highlights the growing value and appeal of solar-equipped properties among Phoenix homebuyers. The specifics of the market, however, reveal more detailed shifts:

  • Owned Solar Systems: Homes with owned solar systems saw a slight decrease in median price to $562,500 from February’s $567,400. Despite the minor drop, these homes remain highly valued, suggesting that homeownership combined with solar capabilities is highly sought after due to the long-term savings and independence from utility companies.
  • Financed Solar Systems: The median price for homes with financed solar systems decreased to $452,000 from $470,000. This decline may reflect changing credit conditions or buyer caution in a fluctuating economic environment.
  • Leased Solar Systems: Homes with leased solar systems experienced an increase to $449,500 from $440,000, indicating a steady interest in more affordable solar home options.
  • Prepaid Solar Lease Systems: The median price for homes with prepaid solar leases saw a significant jump to $608,675 from $569,900, possibly due to their perceived long-term value and the elimination of ongoing lease payments.

Comparison with the Broader Market

The median price for all resale homes in Phoenix was $444,945, which is slightly less than the median price for solar homes, reinforcing the premium that buyers are willing to pay for solar features. The broader market saw a mild increase from $440,000 in February, indicating steady growth across the board.

In terms of sales volume, 544 solar homes were sold in March, accounting for 8.1% of the total resale volume. This represents a significant segment of the market dedicated to environmentally friendly living solutions. Solar homes also maintained a higher closing ratio, fetching 99% of the asking price compared to 98% for non-solar homes, underscoring their desirability.

Historical Context and Year-over-Year Changes

Comparing year-over-year data, the median price of solar homes has increased by an impressive 13.5% from March 2023, significantly outpacing the general market’s growth. This robust appreciation reflects the increasing valuation of solar technology in residential properties. However, the volume of solar homes sold has decreased by 6.5% year over year, a dip that might suggest market saturation or a temporary slowdown in buyer activity, in contrast to the overall market where sales volume increased by 6%.

Market Health and Economic Indicators

Phoenix’s housing market remains tight with just above 17,000 units available, up 23% from last year, yet still limited in the context of growing demand. With a supply of just 2.9 months, the market conditions favor sellers, keeping competition high among buyers. Foreclosure rates remain low, indicating a healthy market overall.

Mortgage rates have stabilized around 7%, still higher than the preferred 5% or lower, which continues to impact buyer affordability and seller willingness to list properties. The economic outlook is cautiously optimistic, buoyed by controlled inflation and the potential for interest rate reductions by the Federal Reserve, which could invigorate the market further.

Conclusion

As we analyze the solar home market in Phoenix in March 2024, it’s clear that these homes are more than just an eco-friendly option; they are a significant and growing component of the housing market landscape. With their ability to attract higher offers and close at rates above non-solar homes, solar properties offer compelling value, both in terms of real estate investment and environmental impact. Looking ahead, the solar home market in Phoenix is poised for continued growth and evolution, shaped by technological advancements, economic factors, and increasing consumer demand for sustainable living options.

A PDF version of these statistics can be downloaded at: https://www.solarhomebroker.com/wp-content/uploads/2024/04/Maricopa-Solar-Stats-Apr-2024-2.pdf

A version of this article can be found at: https://www.phoenixhomebuying.com/phoenix-solar-home-sales-statistics-for-april-2024/


The Solar Home Surge in Phoenix: March 2024

Phoenix solar home sales March 2024

The Solar Home Surge in Phoenix: A February 2024 Snapshot

As we venture deeper into 2024, the solar home market in Phoenix is not just warming up with the season; it’s positively sizzling. February’s figures are in, revealing a fascinating growth trajectory in both the valuation and volume of solar homes, juxtaposed against the broader Phoenix real estate landscape. This growth is not just a mere spike in interest but a solid indicator of a sustainable shift towards eco-friendly living, backed by solid numbers and a keen market interest.

Market Dynamics: Solar Homes Lead the Way

In February 2024, the median price for all solar homes in Phoenix leaped to $493,000, marking a significant uptick from January’s $479,900. This rise is more pronounced in the segment of homes with owned solar systems, which saw median prices soar to $567,400 from January’s $533,000. The appetite for owned solar systems highlights a growing consumer preference for sustainable investments that offer long-term benefits and autonomy from the grid.

Conversely, homes with financed solar systems experienced a dip to $470,000, a counterintuitive trend given the general market upswing. This anomaly could suggest a recalibration of financing terms or perhaps a temporary market adjustment. Leased solar systems, however, saw their valuation inch up to $440,000, indicating a steady demand for more accessible solar home options. The stability in the prepaid solar lease segment, with a slight nudge down to $569,900 from $569,900 in January, further underscores the nuanced buyer preferences within the solar market.

Broader Market Context

When placed in the broader context of the Phoenix resale market, which itself saw a median price increase to $449,000 from January’s $431,742, solar homes are clearly outpacing their non-solar counterparts. This distinction is not just in pricing but also in how quickly they’re moving off the market. Solar homes took an average of 61 days to sell, a full five days faster than the market average for all resale homes.

Volume and Valuation: A Year-over-Year Analysis

Looking back over the year, the median price of solar homes has experienced a robust 9.68% year-over-year growth, outstripping the overall market’s growth and showcasing the burgeoning appeal of solar. Similarly, the volume of solar home sales has edged up by 1.8%, reflective of a steadily increasing consumer shift towards eco-conscious home buying.

Market Health: Inventory, Interest Rates, and Optimism

Phoenix’s real estate inventory, particularly within the resale market, maintains a tight grip, with just above 16,000 homes available, reflecting a 13% increase from the previous year. This inventory level correlates to a brisk 2.9-month supply, indicating a seller’s market where demand outpaces supply. The foreclosure rate, meanwhile, remains negligible, highlighting the market’s overall health and stability.

Mortgage rates, hovering around the 7% mark, continue to challenge both buyers and sellers, yet there’s a palpable sense of optimism. The anticipation of a potential federal interest rate decrease, coupled with controlled inflation, is fostering a positive outlook for both the immediate and long-term future of the Phoenix housing market.

Conclusion: The Solar Home Advantage

February 2024 stands as a testament to the resilience and appeal of Phoenix’s solar home market. As buyers become increasingly savvy about the long-term benefits and cost savings associated with solar energy, we’re witnessing a shift that transcends mere trend status. Solar homes are becoming a cornerstone of the Phoenix real estate market, characterized by their eco-friendly appeal, economic advantages, and a growing preference among homebuyers for sustainable living options.

The surge in solar home sales, against the backdrop of a competitive and evolving market landscape, underscores a broader societal shift towards sustainability. As we move forward, the solar home market in Phoenix is poised for further growth, driven by consumer demand, technological advancements, and an overarching commitment to a greener future. The sun, it seems, is just beginning to rise on Phoenix’s solar home market.

You can download a PDF version of this report at https://www.solarhomebroker.com/wp-content/uploads/2024/03/Maricopa-Solar-Stats-Mar-2024.pdf

A version of this article can be found at: https://www.phoenixhomebuying.com/phoenix-solar-home-market-march-2024-rising-demand-prices-highlight-growth/

Phoenix Solar Home Sales Feb 2024: Rising Demand & Market Trends

Phoenix February solar home sales statistics

Phoenix Solar Home Sales in February 2024: A Beacon of Stability in a Shifting Market

As we stepped into January 2024, the Phoenix real estate market continued to exhibit signs of stability and growth, particularly within the solar home segment. This period offered a clear view into how sustainable living practices are becoming increasingly integrated into the mainstream housing market, reflecting broader economic trends and consumer preferences.

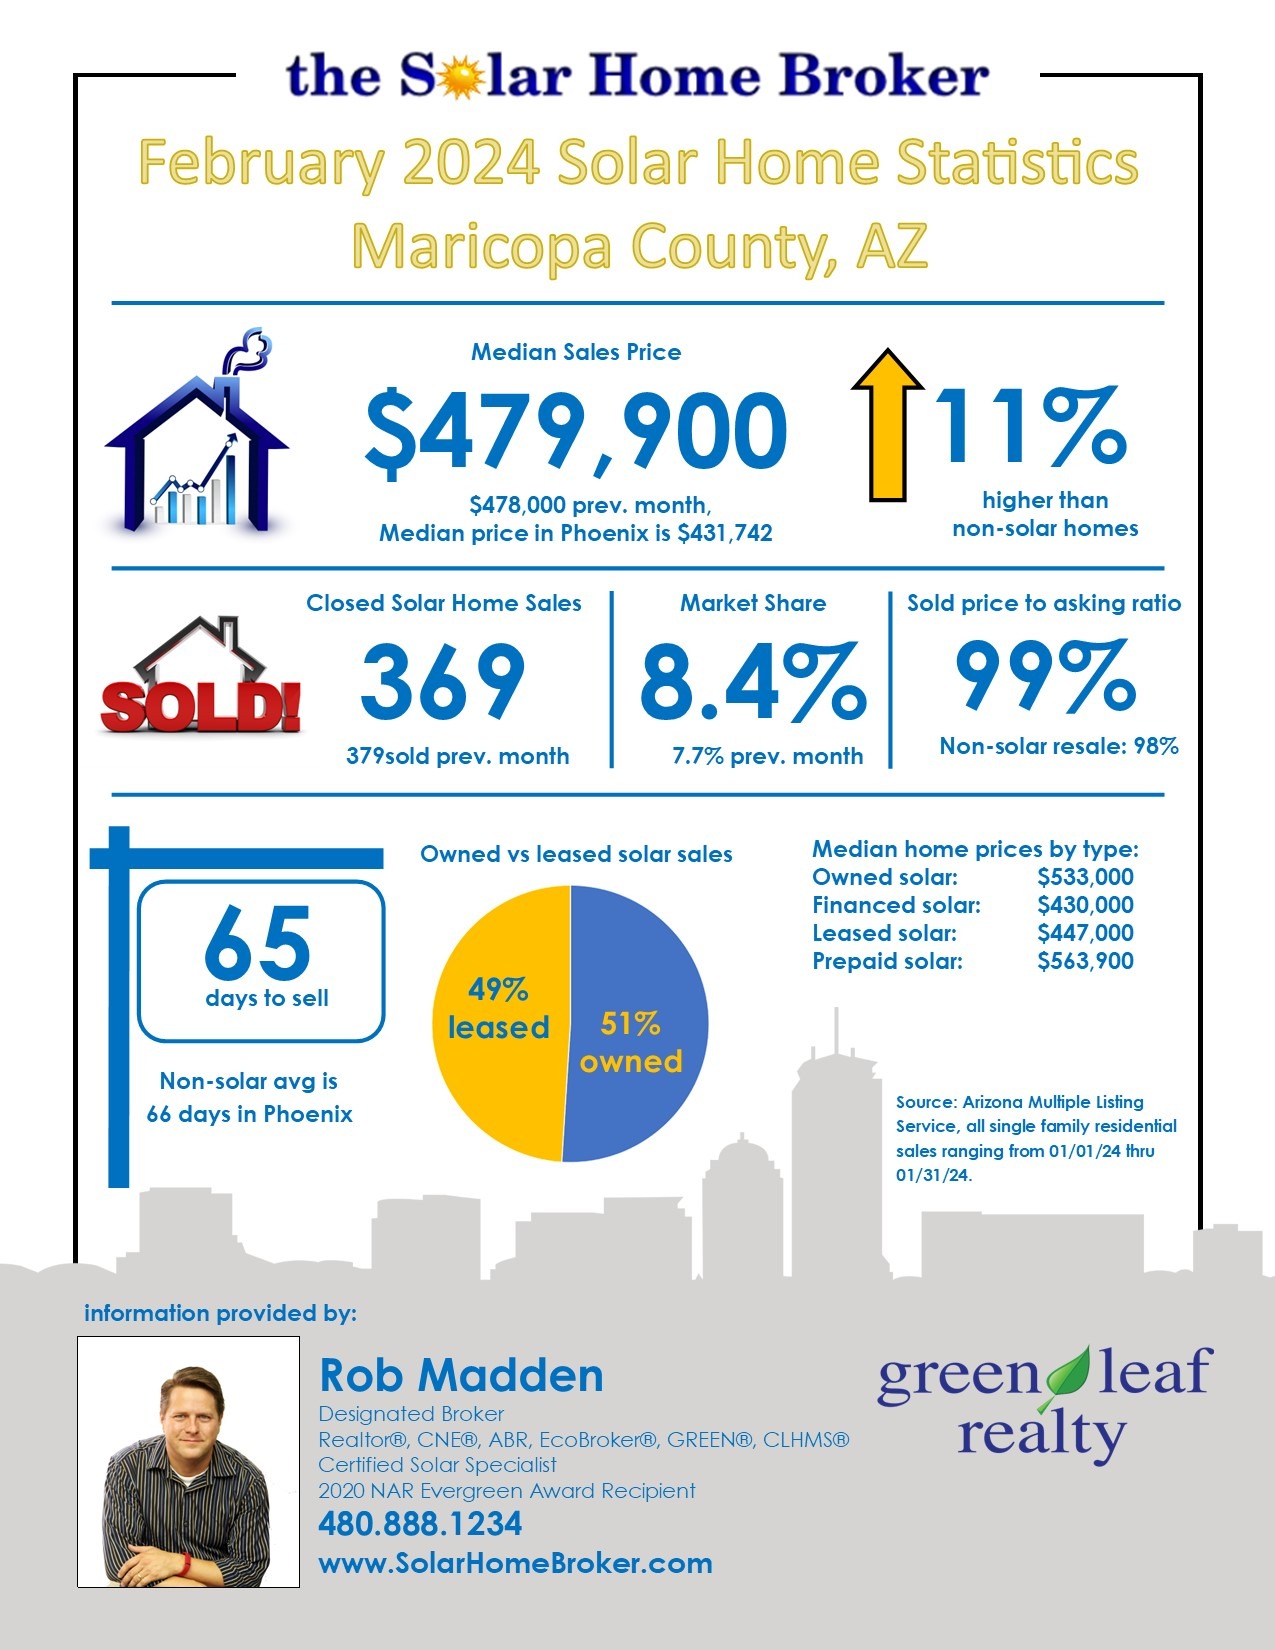
In January, the median price for solar homes in Phoenix was slightly adjusted to $479,000, a minor dip from December 2023’s $478,000. This subtle change belies the significant shifts occurring within various categories of solar homes. Owned solar systems, for instance, saw their median price increase to $533,000 from December’s $515,000, indicating a robust demand for solar homes that buyers fully own. Conversely, homes with financed solar systems experienced a decrease to $430,000, suggesting possible adjustments in financing conditions or buyer priorities. Homes with leased solar systems saw an uptick to $447,000, while those with prepaid solar lease systems adjusted downwards to $563,900, revealing nuanced buyer sentiment towards different solar arrangements.

The overall Phoenix resale market also experienced a slight increase in median prices, reaching $431,742, up from $429,900 in December 2023. This incremental rise reflects a broader market stability amidst fluctuating economic indicators.

January’s sales volume of solar homes stood at 369, representing 8.4% of the total resale volume, a slight increase from December’s figures. This continued interest in solar homes underscores a sustained market appeal, with sellers receiving 99% of their asking price, a figure that surpasses the average for non-solar homes in Phoenix, which stood at 98%.

The composition of solar home sales, with a 51% to 49% split between owned and leased systems, highlights the diverse appeal of solar energy solutions in the residential sector. Interestingly, solar homes took an average of 65 days to sell, comparable to the 66-day average for all resale homes in Phoenix, indicating a balanced market demand for solar-equipped properties.

Year-over-year analysis reveals a 6.88% increase in the median price of solar homes, compared to January 2023, underscoring the growing value proposition of solar investment in residential real estate. The volume of solar home sales also saw a 6.3% increase from the previous year, further evidence of the sector’s resilience and appeal.

The general health of the Phoenix housing market remains robust, with inventory levels maintaining a steady state below the 16,000-home mark, a significant increase from five months prior. This equates to a 3.5-month supply of homes, maintaining a competitive market without tipping into oversupply. Foreclosure rates at 0.7% remain minimal, indicating healthy financial conditions among homeowners.

Mortgage rates, slowly easing from previous highs, have begun to offer some relief, though the market still feels the pinch of rates significantly above the desired 5% threshold. This environment has led to a cautious stance from both buyers and sellers, with the latter particularly hesitant to enter the market under less favorable financial terms.

Looking forward, there is a palpable sense of optimism as the new year begins, buoyed by controlled inflation and the potential for federal interest rate decreases. This optimistic outlook could stimulate further activity in the housing market, particularly for solar homes, as they represent not only a sustainable choice but also an increasingly savvy investment in Phoenix’s competitive real estate landscape.

In conclusion, the solar home market in Phoenix as of January 2024 stands as a testament to the growing integration of sustainability within the broader real estate market. The slight fluctuations in pricing and sales volume reflect a market in flux but also indicate a resilient interest in solar homes. As the year progresses, it will be interesting to observe how broader economic indicators and specific market dynamics continue to shape the solar home landscape in Phoenix, potentially setting the stage for further growth and innovation in sustainable living solutions.

You can download the updated Phoenix solar home statistics in PDF format here: https://www.solarhomebroker.com/wp-content/uploads/2024/02/Maricopa-Solar-Stats-Feb-2024.pdf

Phoenix’s Solar Home Market at Year’s End: A Reflection of Resilience and Change

Phoenix solar sales statistics for January 2024

As 2023 draws to a close, the solar home market in Phoenix offers a detailed narrative of resilience and adaptability amidst fluctuating economic conditions. December’s figures reveal a nuanced picture of how solar homes are maintaining their allure and value, even as they navigate the broader currents of the real estate market.

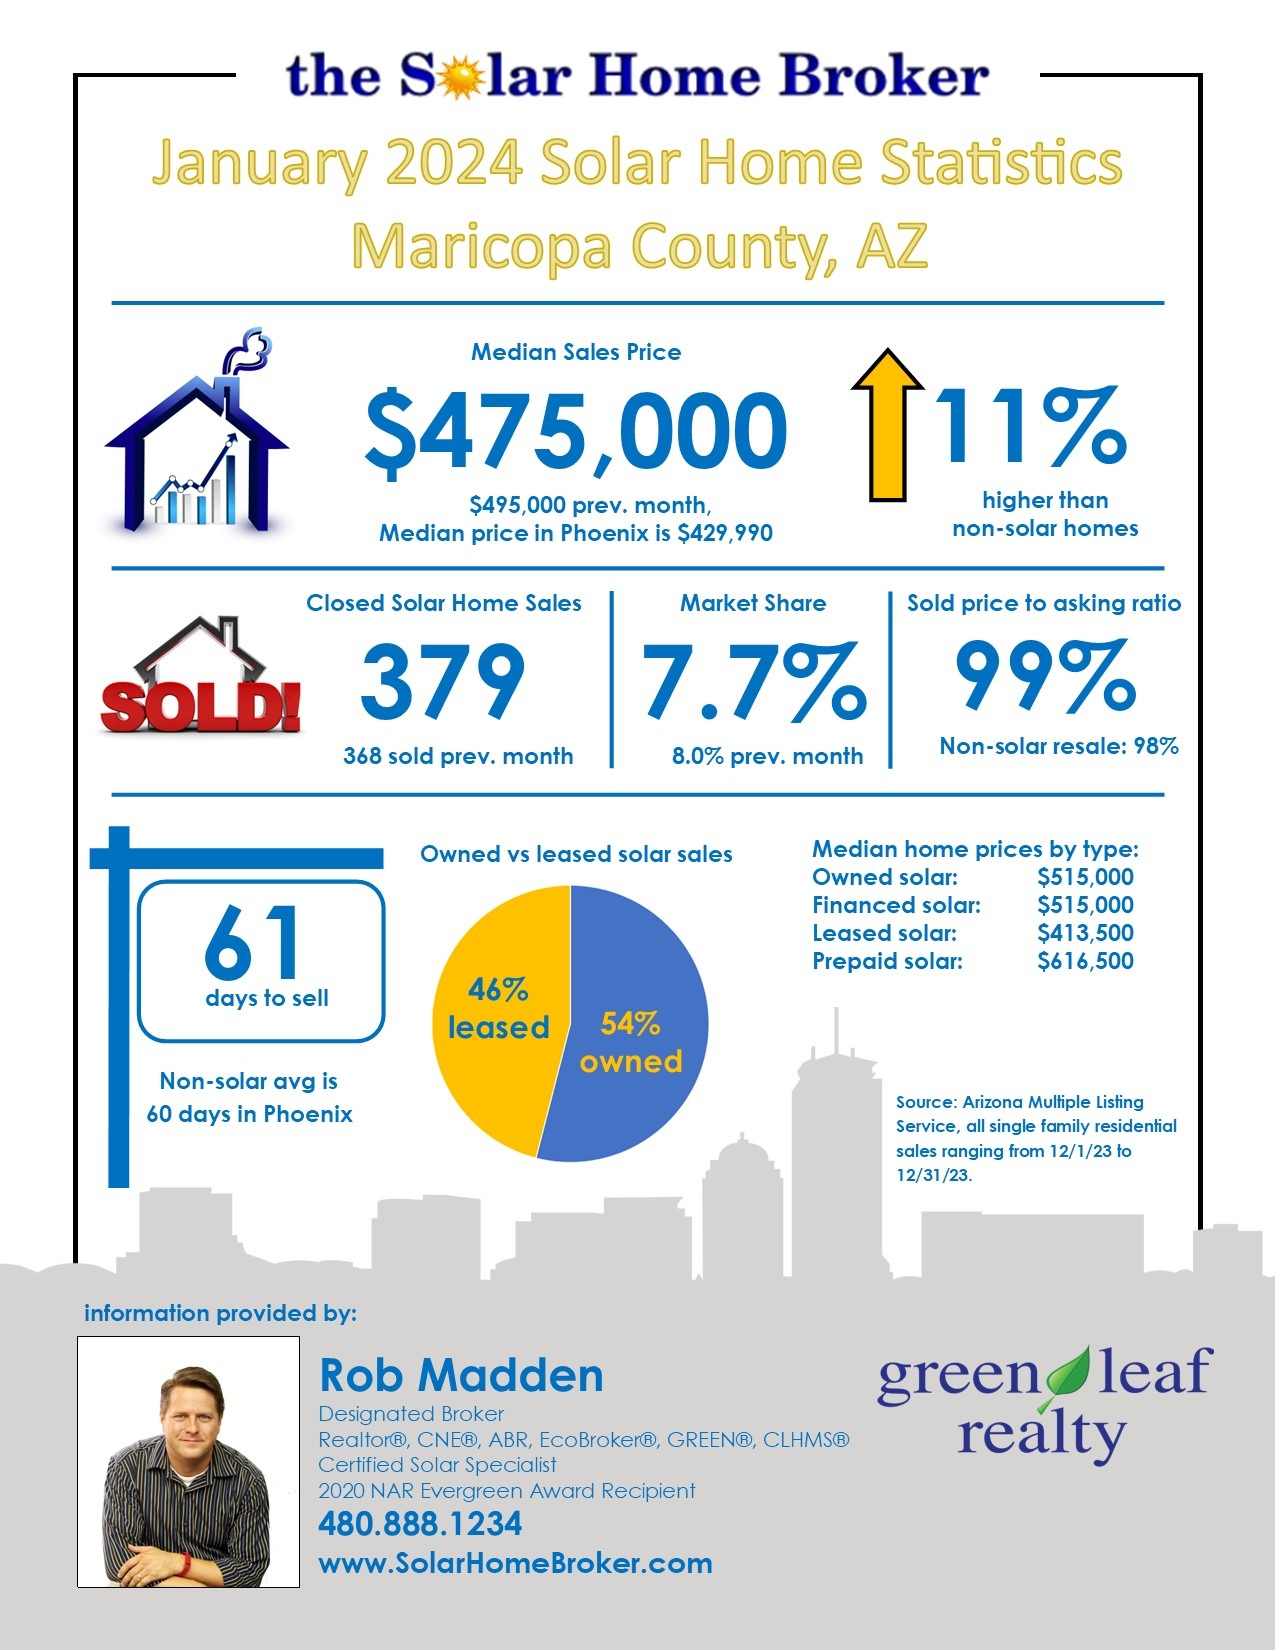
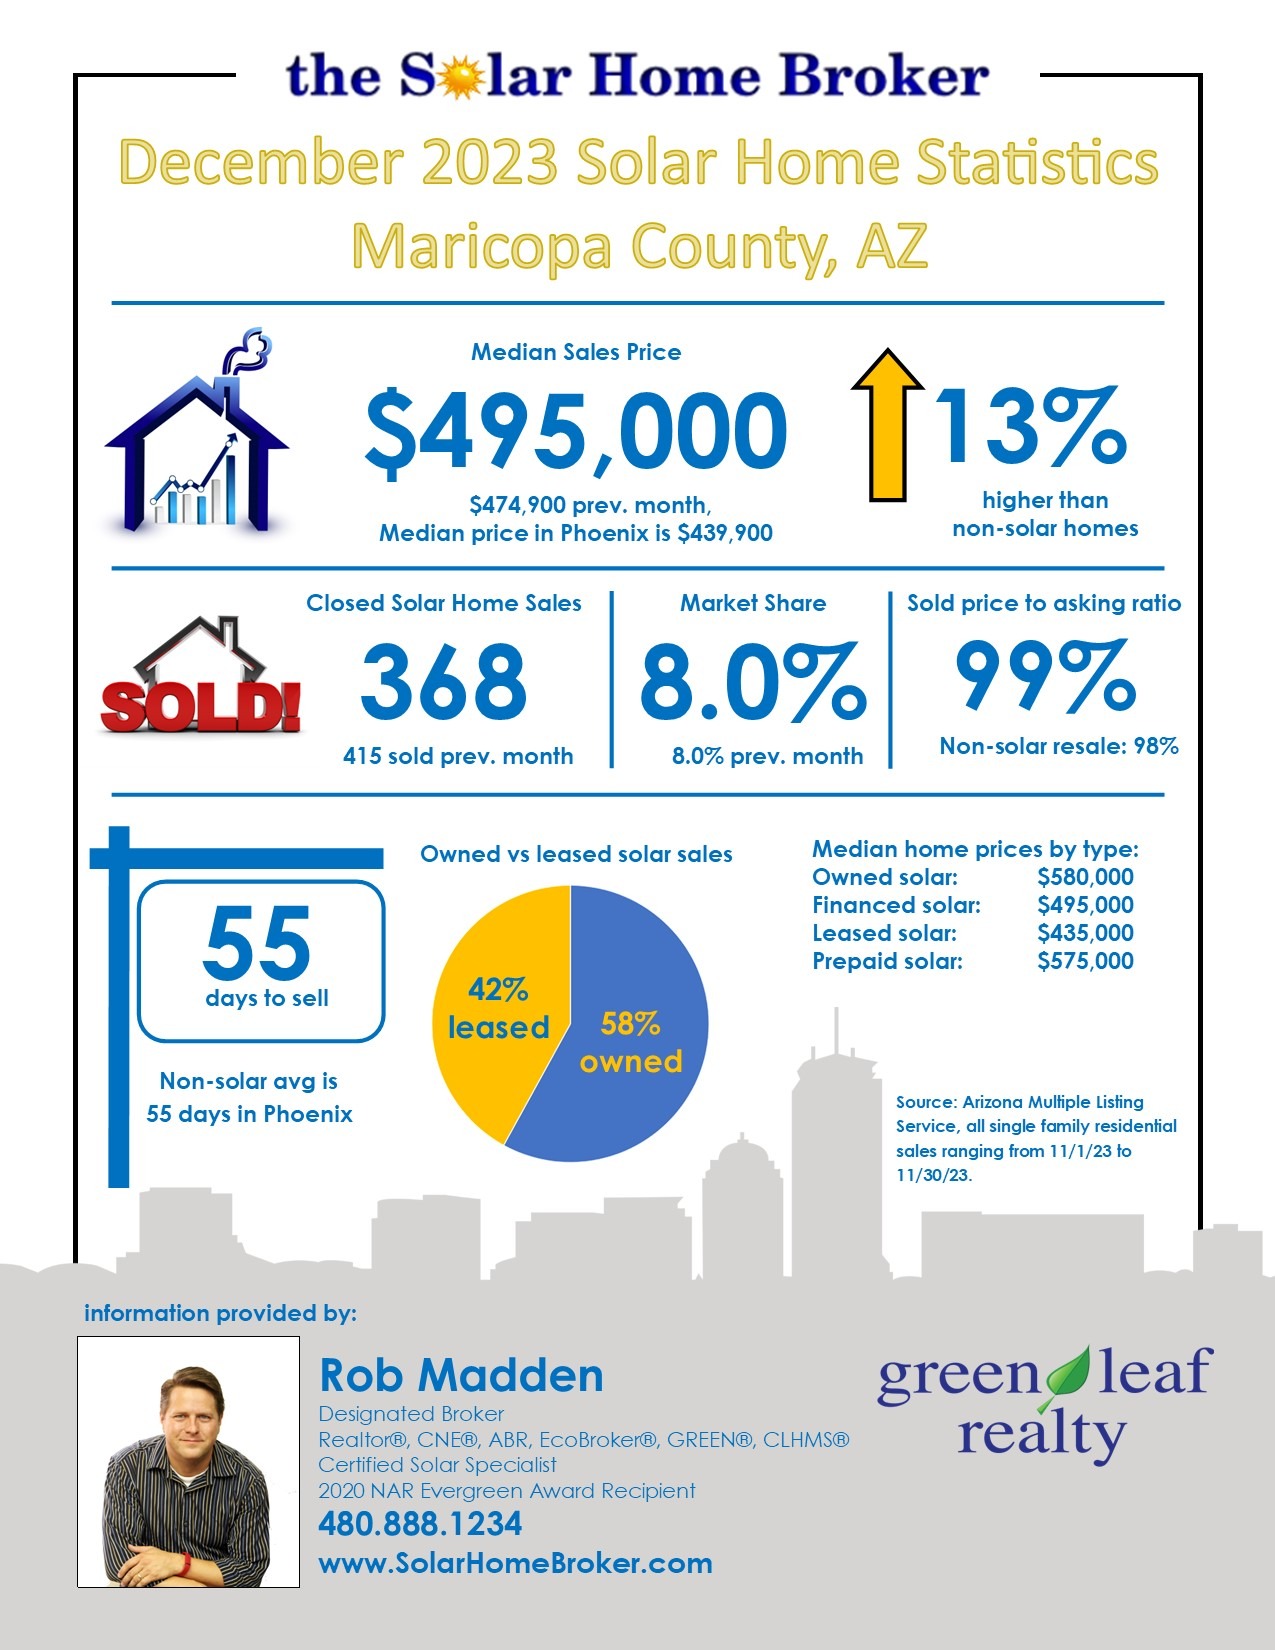
In December 2023, the median price for all solar homes in Phoenix slightly dipped to $478,000 from November’s $495,000. This decrease reflects a market responding to end-of-year economic shifts and buyer sentiment. However, the story varies across different types of solar homes. Owned solar systems, typically a marker of higher value and desirability, saw a significant decrease to $515,000, suggesting some cooling in what might be the market’s most premium segment. Meanwhile, homes with financed solar systems experienced an increase, reaching parity with owned systems at $515,000. Leased systems saw a decrease to $413,500, while homes with prepaid solar leases jumped to $616,500, indicating a robust confidence in the long-term benefits of solar energy.

Comparatively, the overall resale home market in Phoenix decreased to a median of $429,990, a slight dip from November’s figures. This broader context of a cooling market is vital in understanding the relative stability and appeal of solar homes, which consistently fetch a higher median price and demonstrate strong year-over-year growth of 5.05%.

The total number of solar homes sold in December was 379, making up 7.7% of the total resale volume. This represents a slight contraction from the previous month but still underscores a significant niche market’s robustness. Sellers of solar homes continued to nearly meet their asking prices, receiving 99% on average, a testament to the enduring appeal of these energy-efficient, cost-effective homes.

Delving into the sales composition, owned solar systems comprised 54% of the total solar sales, indicating a solid preference for ownership, perhaps due to the long-term benefits and incentives associated with solar energy. The remaining 46% were leased systems, reflecting a market that values both the immediate and long-term benefits of solar adoption.

The average time on the market for solar homes was 61 days, slightly higher than the average for all resale homes in Phoenix, which was 60 days. This marginal difference might be influenced by the premium nature of solar homes, their pricing, or the specific buyer market for these types of properties.

Looking at the year-over-year data, the solar market’s median price increase contrasts with a slight decrease in sales volume, down by 1.7%. In comparison, the overall market’s sales volume was down by 4%, illustrating that while the solar home market isn’t immune to broader trends, it exhibits certain resilience and appeal that sustains buyer interest even in slower economic times.

The general market health in Phoenix is cautiously optimistic. Inventory levels have risen about 31% from four months ago but are still low, with a three-month supply indicating a balanced but tight market. Foreclosure rates remain minimal, suggesting that despite economic pressures, homeowners are generally not in distress. The slight retreat in mortgage rates provides some hope for buyers, and there’s a sense of anticipation with the new year, buoyed by controlled inflation and potential federal interest rate decreases.

As Phoenix enters 2024, the solar home market reflects a microcosm of broader trends: economic uncertainties, evolving buyer preferences, and a steady commitment to sustainable living. The city’s homeowners and potential buyers are increasingly recognizing the long-term value and ecological benefits of solar homes. With this continued interest and potential economic easing on the horizon, the solar home market is poised to maintain its relevance and desirability, offering a green alternative in the vibrant tapestry of Phoenix’s real estate scene.

You can download a PDF version of the statistics by clicking here: https://www.solarhomebroker.com/wp-content/uploads/2024/01/Maricopa-Solar-Stats-Jan-2024.pdf

Phoenix Solar Home Sales in Nov 2023: Rising Demand Amid Market Changes

December solar home sales statistics for Phoenix AZ

November 2023 in Phoenix’s real estate market has been marked by intriguing developments, particularly in the solar home sector. Amidst broader economic challenges and seasonal market trends, solar homes have shown resilience and a unique trajectory.

Median Prices for Solar Homes in Phoenix

The median price for solar homes in November stood at $495,000, marking a slight decrease from October’s $474,900. However, this headline figure conceals more nuanced movements within different categories of solar homes. Owned solar system homes saw a significant increase to $580,000 from October’s $550,000, indicating robust demand for these premium, energy-independent properties. Meanwhile, financed solar system homes also saw a rise in median price to $495,000, up from $474,000. On the other hand, leased solar system homes experienced a modest increase to $435,000, and homes with prepaid solar lease systems witnessed a decrease to $575,000 from the previous month’s $618,850. These fluctuations across different types of solar homes suggest varying levels of market sensitivity to broader economic conditions.

Comparatively, the median price for all resale homes in Phoenix was $439,900, up from October’s $435,000. This incremental increase across the board reflects a steady market, albeit with the subtle impacts of broader economic forces at play.

Total Solar Home Sales in Phoenix in November

A total of 368 solar homes were sold in November, representing 8.0% of the total resale volume. While this volume is a slight decrease from October, it is significant in the context of the year-over-year increase of 5.7%. Sellers of solar homes received 99% of their asking price, outperforming the 98% received by sellers of non-solar homes. This higher achievement rate indicates a continued and perhaps growing appeal of solar homes among buyers.

Ownership trends within the solar market have also seen a shift, with 58% of the sales being owned solar systems, up from 50.3% the previous month, and 42% being leased systems. This suggests an increasing inclination towards owning solar infrastructure, possibly driven by a desire for long-term savings and environmental considerations.

In the broader historical context, the median price of solar homes has increased by 5.02% year over year, compared to the overall resale market in Phoenix, which saw a more modest increase. This highlights the enduring appeal and perceived value of solar homes in a market that is becoming increasingly conscious of sustainability and energy efficiency.

Overall Analysis of Solar Home Sales in November

The general health of the Phoenix housing market continues to be shaped by several factors. Inventory levels remain low, with just under 16,000 homes, although this is a 37% increase compared to three months ago. The supply of homes stands at about 3.5 months, indicating a market that is neither overstocked nor severely under-supplied. Foreclosure rates remain negligible, but the high mortgage rates continue to temper buyer enthusiasm. The gradual retreat from the 8% mortgage rates offers some relief, yet the market remains cautious.

Additionally, the seasonal slowdown typically observed during the holiday season further impacts market dynamics. This period often sees a reduction in new home inventory and sales, aligning with the traditional patterns of the real estate market.

In conclusion, Phoenix’s solar home market in November 2023 tells a story of resilience and adaptability. Despite economic headwinds and seasonal market shifts, solar homes continue to attract buyers, reflecting a broader shift towards sustainable living. As mortgage rates and market conditions evolve, the solar home segment in Phoenix remains a key area to watch, offering insights into the future of residential real estate in the region.

You can download the report here: https://www.solarhomebroker.com/wp-content/uploads/2023/12/Maricopa-Solar-Stats-Dec-2023.pdf

Solar Homes in Phoenix: A Steady Beacon in a Tumultuous Market November 2023

November 2023 Phoenix solar home sales statistics

As the year 2023 wanes, the Phoenix housing market continues to display its unique dynamics, particularly within the solar home segment. October’s data paints a picture of resilience and nuanced shifts, especially when contrasted with the broader market.

The median price for solar homes in Phoenix for October stood at $474,900, a slight uptick from September’s $469,500. This increase, subtle yet indicative, reveals more when dissected. Homes with owned solar systems, which traditionally lead the market in terms of value, saw a decrease to $550,000 from September’s $565,000. However, homes with financed solar systems experienced a climb to $474,000, a notable jump from the previous month’s $449,950. Likewise, leased solar system homes edged up to $425,000, and those with prepaid solar lease systems markedly increased to $618,850. These figures suggest a diversifying market where different types of solar systems cater to varied buyer preferences and economic capacities.

The median price for all resale homes in Phoenix was $435,000, marginally up from September’s $432,190, demonstrating a broader market resilience. The solar home sector, however, continues to outperform the general market in certain aspects. A total of 415 solar homes were sold, representing 8.0% of October’s total resale volume. This sales figure, while slightly lower than September’s, remains significant and underlines the steady demand for solar-equipped properties.

Notably, sellers of solar homes received 100% of their asking price, outshining the 98% received by sellers of non-solar homes. The close balance between owned (50.3%) and leased (49.7%) solar systems in sales underscores a market that appreciates both the long-term investment of ownership and the flexibility of leasing.

Historically, the median price of solar homes has risen by 3.24% from October 2022, showcasing a year-over-year growth that contrasts with the broader resale market’s stagnation. Additionally, the volume of solar homes sold has increased by 13.7% year over year, a testament to the growing appeal of eco-friendly living in the face of climate challenges.

The general market health in Phoenix, however, reflects the complexities of the current economic environment. Inventory levels remain tight, with just below 16,000 homes available, a 37% increase from three months ago. This inventory translates to a three-month supply, indicating a market that is neither overflowing nor excessively strained. Foreclosure rates, at a minimal 0.5%, reinforce this view of a market not plagued by distress sales.

Mortgage rates, having recently retreated from the 8% high, continue to exert pressure on the market. The higher rates are deterring some potential buyers, especially those reminiscing about the sub-5% era. Sellers, too, are reluctant to exchange their low-interest rate mortgages for the uncertainty of current rates. This hesitancy on both ends keeps the inventory levels from ballooning, maintaining a balance in the market.

In conclusion, as we navigate through October 2023, Phoenix’s solar home market emerges as a segment marked by resilience and adaptability. The fluctuating prices across different solar home categories reflect a market that is responding to diverse buyer needs and economic realities. With mortgage rates being a key influencer, the future trajectory of this market will likely hinge on broader economic trends. However, the sustained interest in solar homes highlights a deeper, more enduring shift towards sustainability – a trend that may well define the future of residential real estate in Phoenix.

You can download a PDF version of the monthly solar sales statistics here: https://www.solarhomebroker.com/wp-content/uploads/2023/11/Maricopa-Solar-Stats-Nov-2023.pdf